Saturday, 31 March 2012

Matlab PSNR calculation Example code | Matlab Peak Signal to Noise Ration calcylation

Peak signal to noise ration calculation used as following areas,
  1. Image Compression
  2. Watermarking
  3. Signal processing
and more areas its used.PSNR Matlab code as follows

A = imread('input.jpg');
B = imread(output.jpg');

max2_A = max(max(A));
max2_B = max(max(B));
min2_A = min(min(A));
min2_B = min(min(B));

if max2_A > 255 || max2_B > 255 || min2_A < 0 || min2_B < 0
error('input matrices must have values in the interval [0,255]')
end

error_diff = A - B;
decibels = 20*log10(255/(sqrt(mean(mean(error_diff.^2)))));
disp(sprintf('PSNR = +%5.2f dB',decibels))


In above PSNR code only used in Image processing area.


Related Search : Matlab PSNR calculation Example code , Matlab Peak Signal to Noise Ration calcylation,PSNR matlab code.Matlab Image PSNR Calculation.

Matlab multiple Plots on one Figure Window | Matlab multiple Plots on same Figure window

Here we see multiple Plots on same Figure window on Matlab. This type of graphs used for comparisons.You have put legend for each comparison. Its very simple to make it easy ,just use following syntax .Its very helpful to you.

>>figure;
>>plot(x1,y1);

>>hold on
>>drawnow
>>plot(x2,y2);

>>plot(x3,y3);

>> "

>> "

>> " ect..

example as follows
>> x1 = 1:5;
>> y1 = rand(1,5);

>> y2 = rand(1,5);

>> y3 = rand(1,5);

>> figure;plot(x1,y1);

>> hold on

>> drawnow

>> plot(x1,y2,'color','red');

>> plot(x1,y3,'color','green');

out put as follows. after plotting you have put the legend for each color plot comparison. ie( legend ('Blue','Red','Green')).


Related Search : Matlab multiple Plots on one Figure Window , Matlab multiple Plots Comparison  on same Figure window , Matlab multiple plot example code,multiple Plots one figure window example codes.

Tuesday, 20 March 2012

Multilevel 2-D Wavelet Decomposition Example code | Multilevel Matlab 2-D Wavelet examples

In below example to support for multilevel 2-D wavelet decomposition on Matlab.below syntax used to create your Multilevel 2-D Wavelet.

In matlab wavedec2 use this function for multilevel 2d- wavelet example as below.


>>N = 3; % 3-level 2d wavelet....
>>X = imread('input.jpg');
>>imshow(X);
>> [C,S] = wavedec2(X,N,'haar'); % we choosing haar wavelet.. C is band ,S is coefficients of bands

C is band value .Change bands values
In below we applying inverse multilevel 2d wavelet....

>>output = waverec2(C,S,'haar');
>>imshow(output);


Related Search : Multilevel 2-D Wavelet Decomposition Example code , Matlab 2-D Wavelet examples,Multilevel 2-D Wavelet Decomposition Matlab Example code , Multilevel Matlab 2-D Wavelet code,Multilevel haar wavelet Transform matlab code.

Single Level 2d Discrete Wavelet Transform Matlab Example code | Single Level 2d Wavelet Transform Code on Matlab

In below example to applying single level wavelet transform.

Wavelets are convert the signal into more sub bands like low frequency and high frequency. wavelets used in stenography and watermarking techniques.

>> input = imread('input.jpg');
>> imshow(input);
>>[LL,LH,HL,HH] = idwt2(input,'haar'); % here we use haar wavelet applying

then process and covert any one bands.then applying inverse operation,example as below

>>out_img = idwt2(LL,LH,HL,HH);
>>imshow(out_img );


Finally we construct new image.


Related Search : Single Level 2d Discrete Wavelet Transform Matlab Example code , Single Level 2d Wavelet Transform Code on Matlab,dwt2 matlab examples,dwt2 haar Wavelet Transformexamples,idwt2 matlab examples.

Friday, 20 January 2012

impact factor journal list | List of Impact Factor Journals

Impact Factor mainly calculated based on Journal citation.citation means all the information identifying a publication with quality and professional.

In research area, more Universities must need to publish the papers on impact factor Journals , and also ask them PhD students to published.

In Impact factor journal changing based on selected domain.

For ex.

If you choose networking Domain means 1st preferred IEEE,
If you choose image processing Domain means 1st preferred springer,

So please choose your Journal and published paper....

Please give more comments for Pre-Phd scholars..

Wednesday, 18 January 2012

How to create GUI on Matlab | Make a GUI on Matlab with example

Here we discuss with Creating GUI on Matlab

GUI : GUI is the Graphical user Interface for Particular project.

Simple Steps are following .

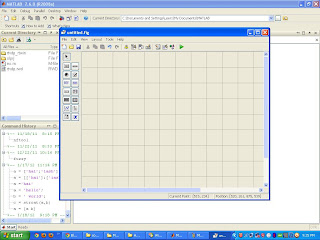
1.Goto File Menu ->New->GUI


2. Then Place the Axes, Text boxes and Buttons on your window (If you need then).


3.Then save the File.While saving matlab makes two files.fig and m file.


4.Then after saving , you press F5 then you sea your out put GUI.


Finally you have successfully create GUI on Matlab.In Matlab contain more toolboxes like text box,static box,radio button,check box,button,slider,axes,list box and ects...

Tuesday, 17 January 2012

Matlab String Processing | Matlab String operations Concat,Substring and String Find index

Matlab string processing is very Simple.Here we looking some String Processing operation.

String : String is contain more than character.characters are alphabetical's ,numbers and special operators.

In matlab strings are stored in matrix and cell arry.

>> a = 'hai'; % This one is vector string
>> a = {'Hai','Friends'}; % cell array strings...

Con-cat Strings :

In matlab we have used two type of technique used to combine strings.
1.Using Normal square bracket.
2. strcat function (built in function on matlab)

example


>> a = 'hello';
>> b = ' world';
>> c = strcat(a,b) % for built in function

c =

hello world

>> a = [a b] % using square bracket..

a =

hello world

More Functions are below

strfind : Finding String Character .its return the index of pattern...

strmatch : Matching two string patterns.If match means it returns 1 otherwise 0.


Related Posts Plugin for WordPress, Blogger...